What is marketing attribution and how do you report on it?
 Carel Schrier
Marketers have an enormous number of channels and opportunities to connect with their customers. The buyer's journey is far from linear, and consumers interact with businesses across multiple channels before making a purchase. This naturally creates opportunities for you as a marketer, but it also poses a significant challenge.
For marketers, it is important to understand which channels leads come from and through which channels they convert. You need to accurately predict the impact of increasing or decreasing your budget in order to execute a good marketing strategy. With multiple touchpoints and buyer journeys becoming increasingly complex, gaining this visibility becomes much harder.
Reporting on individual channels, such as website traffic or open rates, will not fully cover what is needed when it comes to predicting and deploying your marketing engine. Unless you know exactly how the interaction comes about, these remain just statistics.
For many marketers, it can therefore be difficult to gain insight into this kind of information. You would have to wade through a lot of data, consult various sources and study the figures to move forward.
Unless you use marketing attribution.
What is marketing attribution?
Marketing attribution is a reporting strategy that enables marketers and representatives to map out the impact towards a specific goal. If you, as a marketer, want to see how a blog post or social strategy has influenced sales, you can use marketing attribution.
Or, as HubSpot describes it: 'Attribution is understanding which interactions a person or group of people has undergone during their journey towards a desired outcome or conversion point'.
What is an attribution report?
Marketing attribution reports bring together all the relevant interactions from your buyers' journey. Using pre-built models, it gives you answers about which channels and content help you achieve your marketing goals.
Multi-touch attribution measures and assigns value to all the interactions a contact has had leading up to an important moment in their journey.
These reports are valuable because they enable marketers to identify the exact marketing and sales efforts that led to a conversion in the flywheel. By then using this information, you can make better informed decisions about where to invest your time and resources.
To pick up the earlier example again, as a marketer you can see how a blog post or social strategy has influenced sales. As a sales manager, you can see which sales activities generated the most revenue. Both people can use this reporting strategy to attribute real financial value to these efforts.
HubSpot supports two types of multi-touch attribution reports. Attribution for contact creation (contact create attribution) measures the journey of contacts in your CRM up to the moment they were created. Revenue attribution measures the journey up to the moment they became a customer.
Lead attribution
Lead attribution is a specific type of marketing attribution used to show how marketers influence the number of leads in a given campaign. Although leads are not direct sales, they are still important because they show how your marketing content or strategy can generate potential or new audiences that can lead to sales or more profit.
B2B marketing attribution
This is another specific form of marketing attribution. B2B marketing attribution relates to the business-to-business field, as the name suggests. Companies in this field sell products or services to other businesses in their industry or to other professionals. B2C attribution often relates to smaller purchases, whereas B2B attribution can relate to larger purchases from companies, memberships or leads.
Which attribution report is best for my team?
The best way to start is to think about which goal you are trying to measure. Do you want to see which marketing and sales activities led to leads, or do you want insight into how much revenue they generated?
Below, we show visually how you can think about when to use which type of attribution report.
Contact create attribution takes into account all interactions up to the moment the contact (or lead) was created in your CRM. This is a particularly powerful report for marketers, as it can definitively measure which blog posts, social media posts or adverts are better at generating new leads. The report shows to what extent the interactions within the journey contributed to generating contacts.
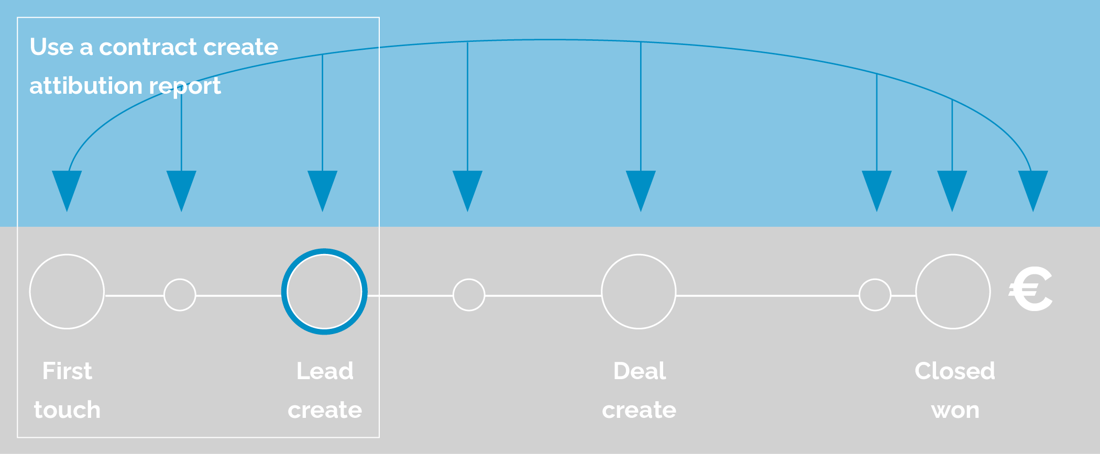
This contact create attribution table shows how much you can attribute to each referring URL for the contacts created. This does, of course, mean that a URL can only 'create' a fraction of a person, since interaction with a specific URL is only a fraction of their journey.
Revenue attribution takes into account every interaction a contact has had with your business up to the moment they became a customer. The report shows to what extent the interactions contributed to generating revenue.
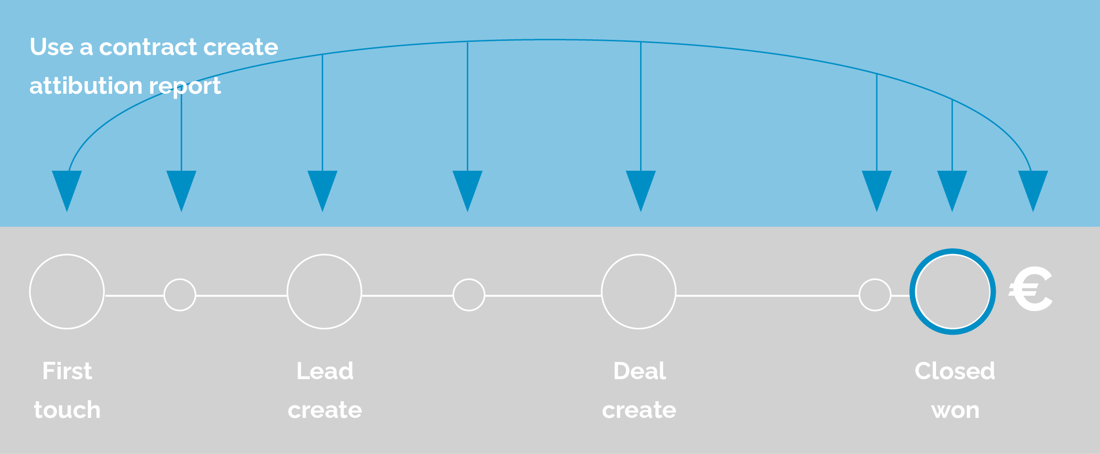
This table shows how much of a deal's revenue can be attributed to each asset or touchpoint.
Attribution models
You might now be wondering whether all page views or marketing channels are treated equally when it comes to conversions. You are right that they are not, but bringing all interactions from the journey together in a single report is only one option. The other option is to use different attribution models.
By using an attribution model, you can assign a different weighting to each interaction. Some models, for example, base the calculation on the first or the last interaction within the customer journey. Other attribution models use all kinds of calculations to distribute the weighting.
How do you use different attribution models?
One of the most common questions from marketers is which model they should use. The answer depends heavily on the goals you and/or your team have set. The most important thing to remember is that there is no 'one size fits all' model when it comes to attribution. You can use several models. For revenue attribution, the following models are available:
- First interaction: This model bases the calculation on the first interaction that led to a 'closed won deal'.
- Last interaction: This model bases the calculation on the last interaction that led to a 'closed won deal'.
- Linear: This model looks at all interactions that led to a 'closed won deal' and then assigns an equal share to each interaction.
- U-shaped: This model assigns 40% of the revenue to the first interaction and 40% to the interaction that created the contact. The remaining 20% is distributed evenly across the other interactions in between.
- W-shaped: This model assigns 30% of the revenue to the first interaction, 30% to the interaction that created the contact and 30% to the last interaction. The remaining 10% is distributed evenly across the interactions in between.
- Full-path: This model assigns 22.5% of the revenue to the first interaction, 22.5% to the interaction that created the contact, 22.5% to the last interaction and finally 22.5% to the interaction that closed the deal. The remaining 10% is distributed evenly across all other interactions in between.
- Time-decay: This model gives more weight to the most recent interactions. The weighting for certain interactions decreases the longer it takes before a deal is closed.
For contact create attribution, the following models are available:
- First interaction: This model bases the calculation on the first interaction performed by a contact.
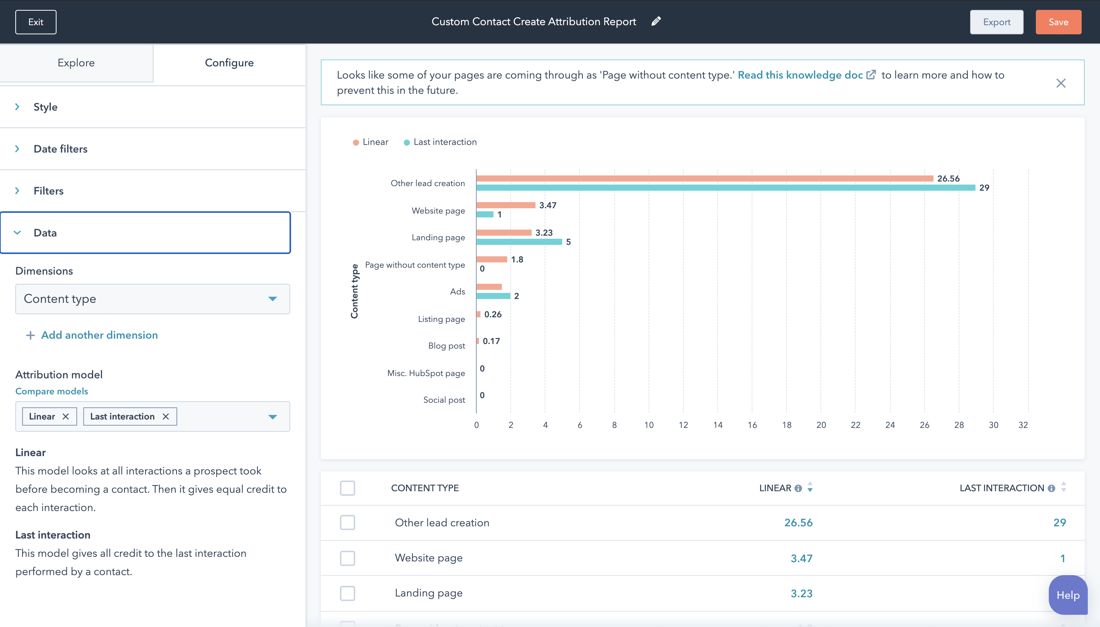
- Last interaction: This model bases the calculation on the last interaction performed by a contact.
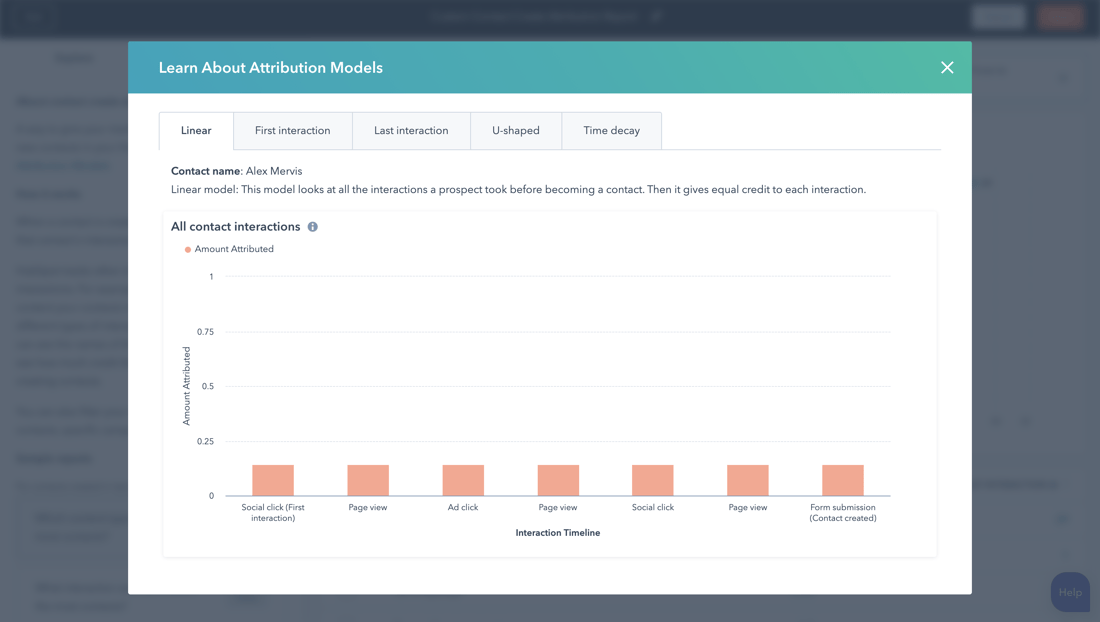
- Linear: This model looks at all interactions a prospect undertook before becoming a contact. It assigns a proportional share to each interaction.
- U-shaped: This model assigns 40% weighting to the first interaction and 40% to the interaction that created the contact. The remaining 20% is distributed equally across all interactions in between.
- Time-decay: This model gives more weight to the most recent interactions. The weighting for certain interactions decreases the longer it takes before the contact is created.
When would you use attribution reports?
Marketers use attribution reports to help make decisions. Think of reviewing which pages or marketing channels generate the most conversions. There are several practical examples of this type of reporting, and we have described a few below.
1. How many leads has my blog generated? Which content generates the most leads?
Content is the beating heart of inbound marketing. Every marketer wants to know how content contributes to the number of leads they generate through their blog. Attribution reports bring this information together to show how many times a blog post was viewed just before conversion. For bloggers who cannot directly attribute lead generation to their content, this is a huge win.
The information gathered in these reports helps marketers gain insight into which types of content perform better. This could include popular topics, content formats or the timing of promotion. With better insight into which content generates more leads, marketers can make better decisions within their marketing activities.
2. Which marketing channels generate the most leads? And which channel is best to invest in?
Once you have discovered which type of content generates the most leads, it is important to know which channels are the most successful. Once you have the answer to these questions, you gain more insight into why this content performs so well.
It may be that email marketing, for example, is the best place to distribute your content, but the current focus is mainly on social media, which yields nothing. Insight into the quality of your marketing channels is essential to understand which resources you should invest in. If you were to double your investment in social media and get no leads in return, that would be a waste of your time, money and resources. Because if it turns out that email marketing brings in more leads with less effort, it is a no-brainer where you should perhaps prioritise.
3. Which pages are viewed the most before someone becomes a customer?
Besides your blog and landing pages, there is more content on your website that contributes to conversions. Think, for example, of your homepage, pricing page, about us page or any other page that has contributed to the conversion in the funnel. When you create a report based on the pages viewed by users, you can find out which pages have been visited the most. This will help you understand which pages perform well or which pages need to be optimised.
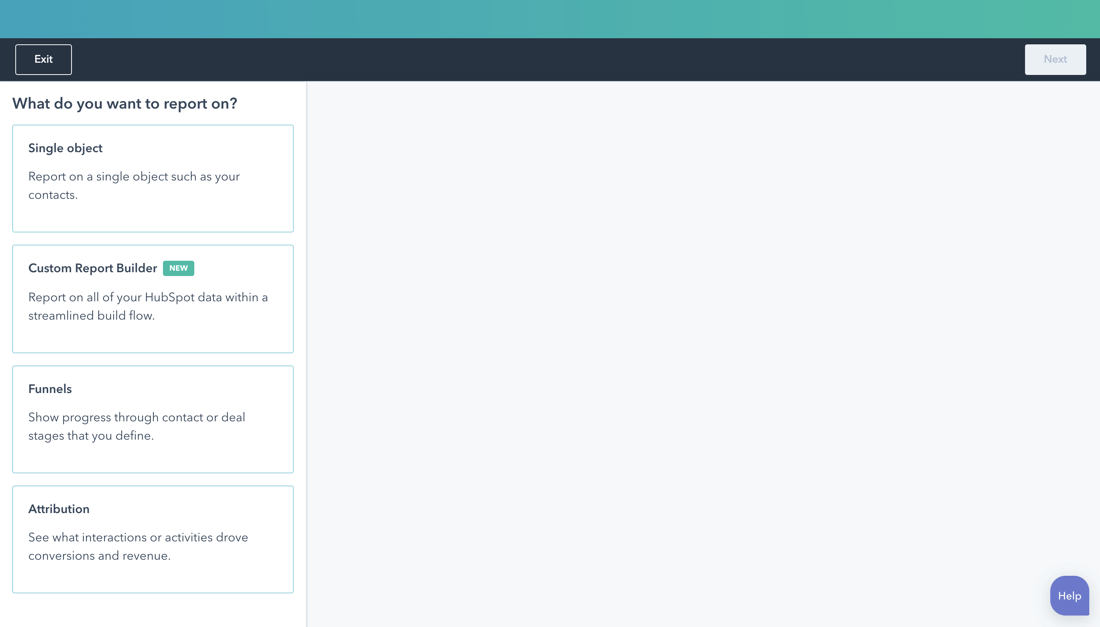
How do you create an attribution report in HubSpot?
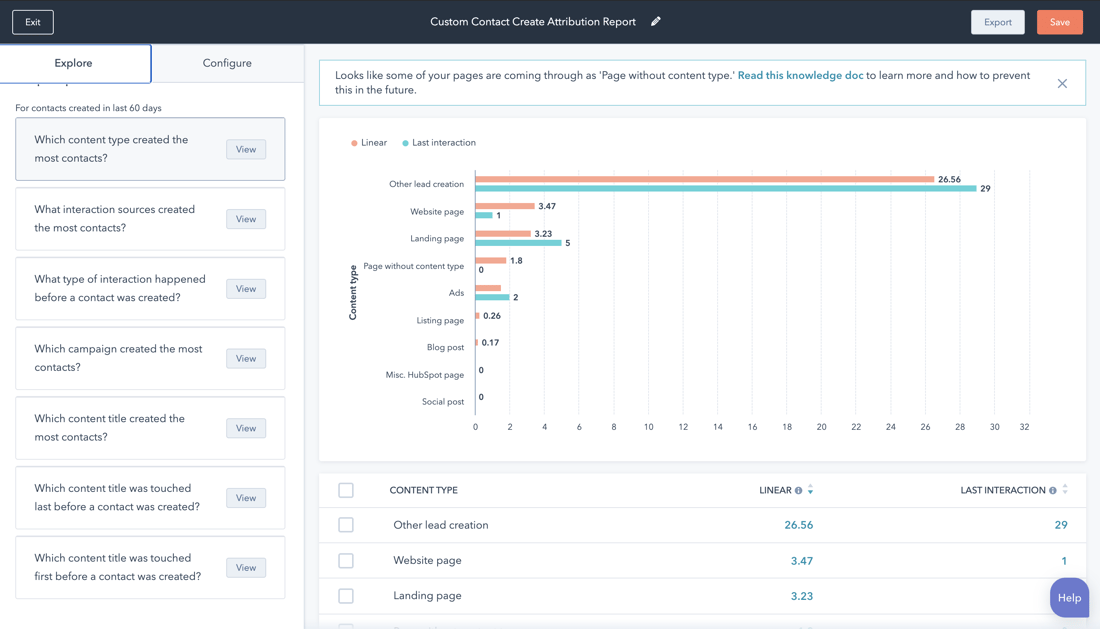
When using HubSpot, you can simply go to Reports and then click 'create custom report'. Here you can choose the 'Attribution report'. You will then see the following screen:
 Once you have chosen which attribution report you want to build, you will land on the 'explore tab'. This is useful if you have never set up such a report before or if you need a refresher.
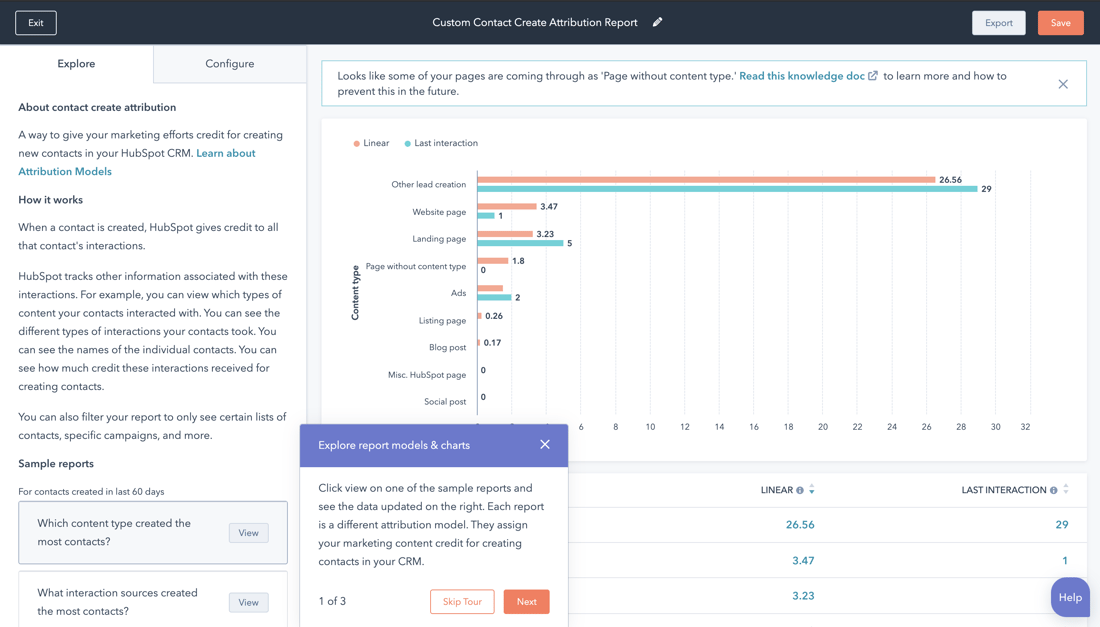
Every attribution report includes a 'Learn about' option that you can simply click to see how the calculation works within the interactions.
As you scroll down, you will find the most popular reports that have already been put together. They immediately contain your own data and can be added directly to your dashboard.
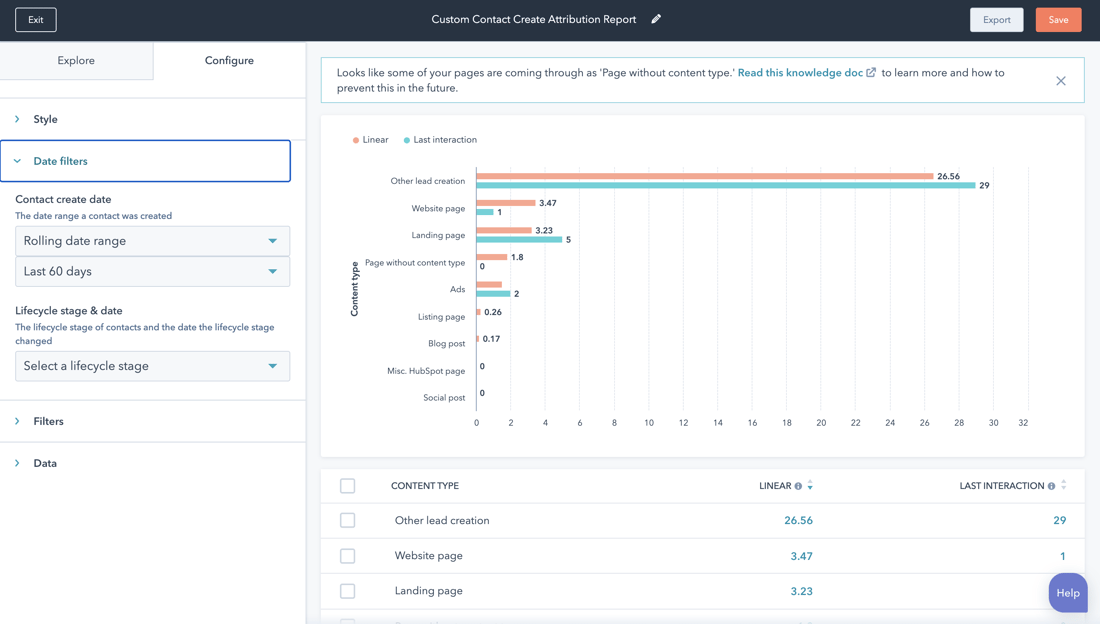
The 'explore tab' is good for getting started, but the 'configure tab' is where you can set everything up. Every attribution report has four options you can adjust: style, date filters, filters and data.
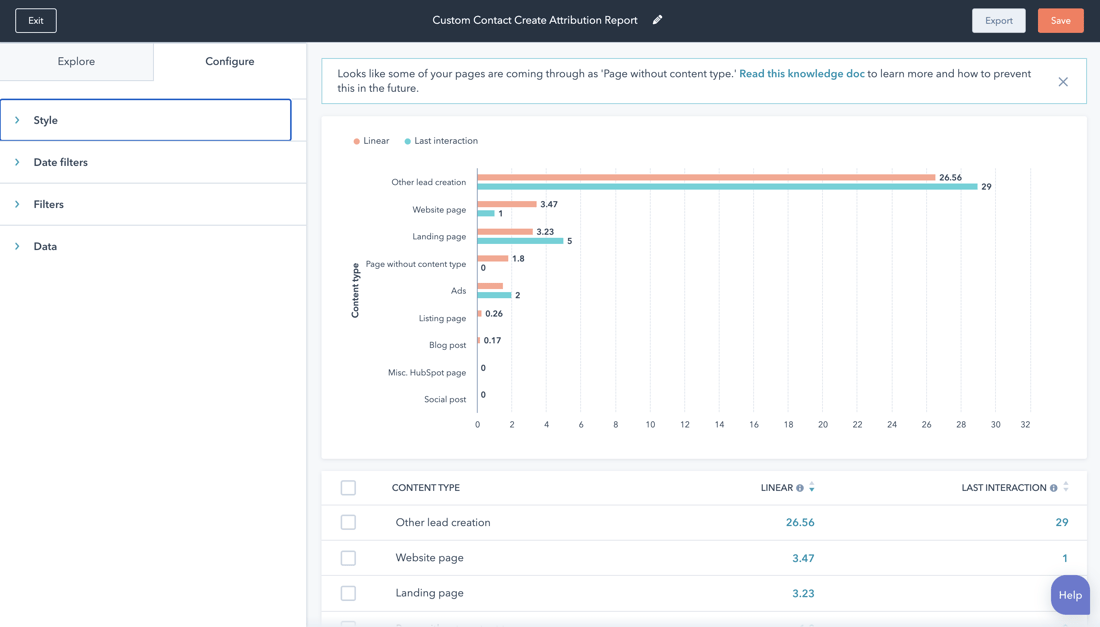
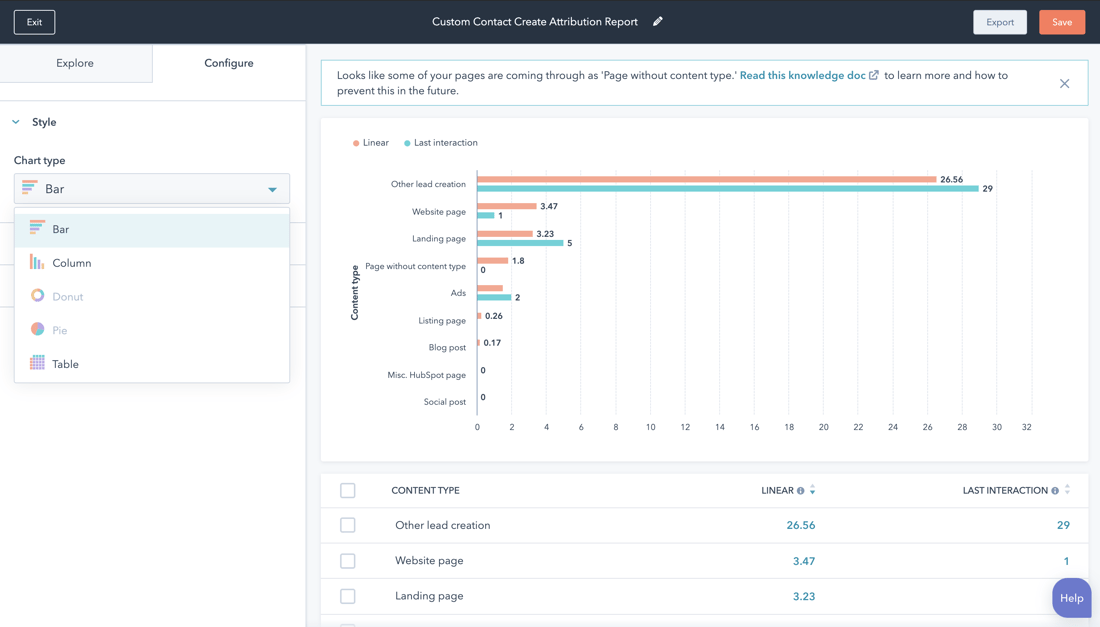
Style
Here you can indicate how you want to present the data, for example as a pie chart, table or other options.
Date filters
With the date filters, you can specify which period you want to analyse.
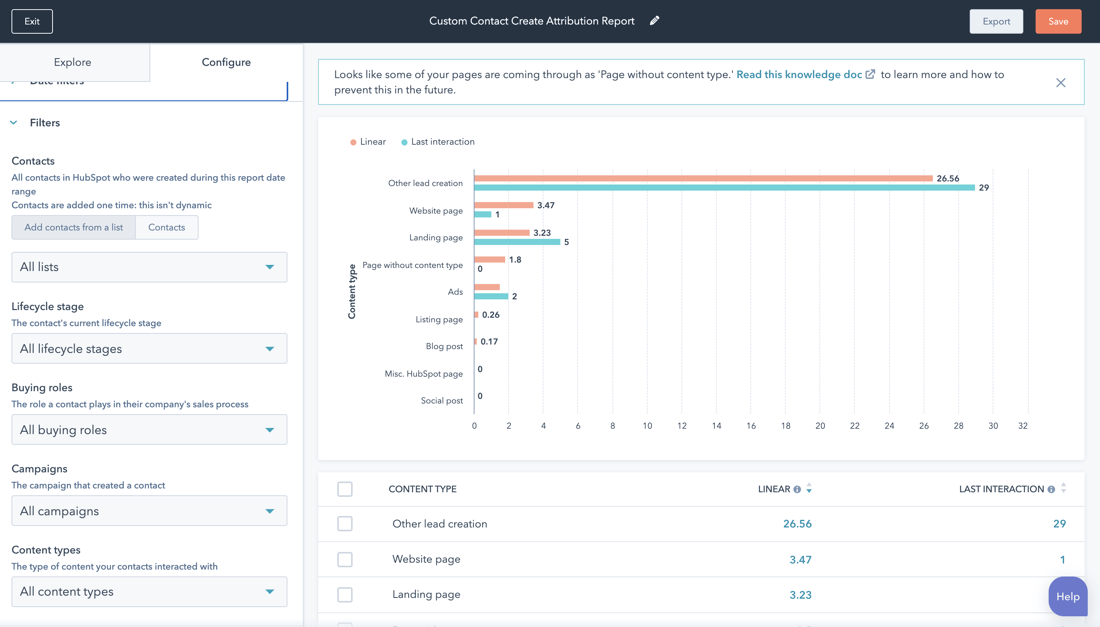
Filters
With the filters, you can analyse specific datasets from your CRM. For example, you can see specifically what the revenue has been for a deal owner (or sales manager) and which paths they took to reach a 'closed-won' deal. It is also possible, for example, to analyse specific emails, advertising or other forms of content.
Data
Finally, you have the option to select data. This allows you to analyse different aspects of the journey. For example, you can gain insight into which type of interactions, content or sources contributed most to your goal.
How do you use attribution in Google Analytics?
You can also use attribution models in Google Analytics. The terminology differs slightly, so let's list them here.
- Last Interaction: This model bases the calculation on the last page or source someone visits. This one is assigned the conversion.
- Last Non-Direct Click: In this model, the second-to-last page or source someone visits before a conversion takes place is assigned the conversion.
- Last AdWords Click: In this model, the most recent time someone clicked through to your website from your AdWords campaign is assigned the conversion.
- First Interaction: Within this model, everything is attributed to the first source.
- Linear: In this model, everything is distributed equally across every source or page in the conversion path.
- Time Decay: In this model, the pages or sources visited most recently are attributed more. Pages and sources visited earlier are attributed less of the conversion.
- Position Based: Here, 40% of the conversion is attributed to the first and last interaction. The other 20% is attributed to the interactions in between, or the middle interactions.
Want to know more about the various Google Analytics models and how to use them? Then you can read more in the Analytics Help Centre .
The biggest difference between the reports in Google Analytics and HubSpot is that you cannot link the report in Google Analytics to specific contacts. This is possible when using HubSpot. So in Analytics, you cannot apply attribution trends to specific personas, contact groups, lifecycles or other categories that may be relevant to your business. Something to keep in mind when choosing which report to use.
Get started with attribution
Want more insight into your marketing performance but not sure where to start? Book a call with Carel.